Fiber optic chemical sensorsPrepared by Artur Dybko INTRODUCTIONFiber optic chemical sensors (FOCS) can offer several advantages over traditional sensors. The light weight and small size of fiber optic sensors are strongly complemented by their strong immunity to electromagnetic interference. Since the fiber sensors are made of glass they are environmentally rugged and can tolerate high temperatures, vibration, shock and they can operate in extremely harsh conditions. There are many excellent reviews on FOCS published in recent years [1,2,3]. There are many types of fiber optic chemical sensors which can measure concentration of neutral or charged species. The principle of operation of FOCS will be explained on the example of pH sensor because it is one of the most important sensor in analytical chemistry.
The sensor consists of three main parts: light source, optrode and detector. The main part of the sensor, so-called optrode, contains an appropriate indicator which changes its optical properties in dependence on the analyte. In most cases, it is necessary to use an indicator because the analyte does not give or exhibit changes of optical properties. The indicator can change, for example, absorbance or fluorescence intensity. The light source is matched to the so-called analytical wavelength of the indicator then the best sensitivity of the sensor can be obtained. Detector, usually photodiode or PMT, converts optical signal into electric one which is next electronically processed. OPERATING PRINCIPLE
The pulse of light from a light emitting diode (LED) is coupled into optical fiber and transmitted to a pH sensitive membrane. The membrane changes its absorbance (colour) in dependence on pH of the sample. If the absorbance is quite low the light is only slightly absorbed which is depicted by almost the same pulse of the light returning to the photodiode. When the pH of the sample is changed the absorbance of the membrane increases so the returning pulse of the light is smaller (see Fig.3).
Light is usually modulated to a square wave because the measurements are not influenced by an ambient light and in order to increase the signal to noise ratio. Sensors can be also based on the use of fluorescence indicator immobilized in the membrane.
In this case, the light excites molecules of the indicator which emits light at different wavelength. The analyte can, for example, influence on the intensity of the fluorescence radiation which is depicted by different amplitude of the returning pulses (see Fig.4).
SIGNAL CONVERSION IN THE SENSORTypical conversion process of the signal in the FOCS is presented in Fig.6.
Chemical signal caused by the analyte is converted into optical one in chemooptical interface. The chemooptical interface consists of membrane with an appropriate indicator. The indicator changes its optical properties (e.g. absorbance, fluorescence) in dependence on analyte. Such an optical signal with information about sample under test is converted into electric signal in an optoelectronic interface. The main part of this interface is the photodetector connected to an electronic circuit. The electric signal can be acquired and processed by PC-lab card. In the case of a pH sensor signal is processed according to procedure shown in Fig.7.
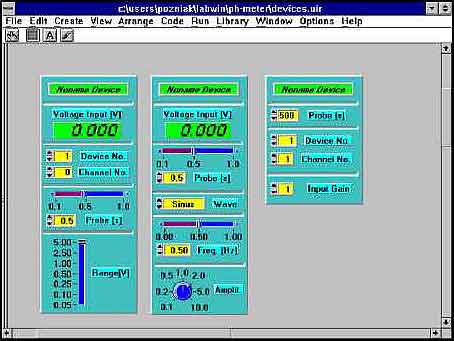
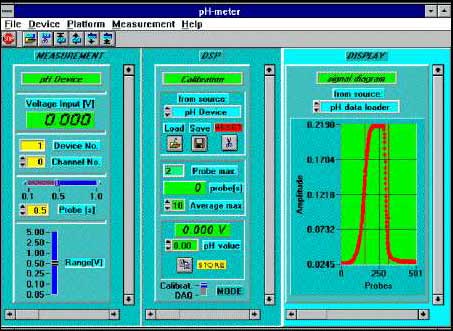
The signal from the sensor is acquired by the card, then it is processed according to the calibration procedure and displayed on the monitor. The acquired data can be saved on the disk. EXAMPLE OF FIBER OPTIC pH SENSORThe fiber optic system can be controlled by a software developed in Lab Windows environment. The main idea of the software is to design user friendly and interactive application which can be applied in many sensor configurations. The user can set up its own application based on pre-design modules. There are many modules possible to use in each phase of signal processing. Some typical ones designed for signal acquisition are presented in fig.8.
The user has to chose a module which is the most suitable for its application and place it on the screen. Similar modules are designed for each part of signal processing. It is possible to use as many modules as the user needs. Every module has its own name and in this way it can be recognized by any module. The modules shown in fig.8 allow to set the gain of the acquisition card, sampling rate, channel of the card etc. The output signal from the card is transmitted to further processing. Fig.9 shows application software designed for a pH sensor with the use of different modules.
The signal from the sensor is amplified by proper settings of control module of Lab-PC+ card. Next module is used for signal processing where calibration formula is applied. The calibration data can be saved and retrieved for each sensor. Last module gives graph with dependence of the signal versus time. When appropriate settings of the card and calibration procedure were done it is possible to switch off any display which is not important during the measurements without any influence on work of the system. The modules left will be rescaled automatically. For example, only pH value can be displayed on the monitor. Main features of the application:
Example of sensor configuration The most basic version of the experimental set-up is shown in Fig.10.
Modulated light from a light emitting diode (LED) is transmitted to the optrode by one arm of the fiber optic bundle. The light matched to the maximum of the molar absorbance of neutral red (560 nm) is reflected in dependence on pH variations and then it is transmitted to a photodiode by the second arm of the bundle. The photodiode is connected with a transimpedance amplifier and active filter. The electrical signal obtained is acquired and processed by a pc-lab card with 12-bit A/D converter. The optrode was built on the common end of the bundle by the use of removable Teflon tube, which holds an optomembrane. REFERENCES
OPTICAL FIBER TECHNOLOGYPrepared by Dorota Stadnik All optical fibers consist of a core having the refractive index higher than of surrounding cladding. They can be made of just glass or polymer, or combination of both. They also have protective polymer layers called buffer or jacket.
There are two methods to manufacture optical glass fiber: either directly drawing the fiber from molten glasses, which are placed in two concentric crucibles (Double Crucible method) or from a glass rod called preform. Nowadays most optical fibers are made from the preform. There are three steps in this method:
The preforms are fabricated using chemical vapor deposition methods [1]:
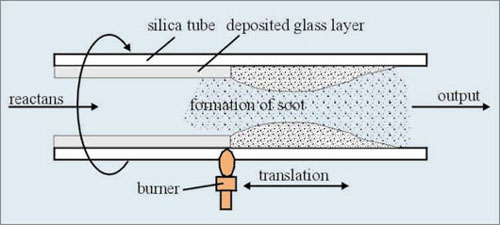
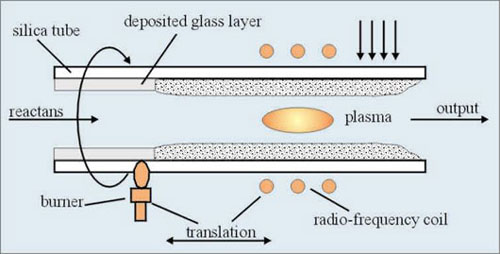
All these methods are based on thermal chemical vapor reaction that forms oxides, which are deposited as layers of glass particles called soot, outer rotating rod or inside glass tube. The same chemical reactions occur in both methods. Starting materials are solutions of SiCl4, GeCl4, POCl3, and gaseous BCl3. These liquids are evaporated within oxygen stream and form silica and other oxides. Chemical reactions proceed as follows: SiCl4 + O2 → SiO2 + 2 Cl2 Germanium dioxide and phosphorus pentoxide increase the refractive index of glass, whilst boron oxide - decreases. These oxides are known as dopands. Changing composition of the mixture during the process influences refractive index profile of the preform. Modified Chemical Vapor Deposition (MCVD)This method was developed by Bell Laboratories [2]. The gaseous mixture of reactants described above is fed at the end of a rotating silica tube. This tube is heated by a traversing oxygen-hydrogen burner (Fig.2). As a result of chemical reactions glass particles, called soot, are formed. These particles are deposited on internal wall of the tube. The soot is then vitrified by the traversing burner to provide a thin glass layer. The process is repeated many times as the cladding layers and core layers are formed. When the deposition is finished, the temperature of the burner is increased to collapse the tube into a solid preform. The entire process is highly automated and all process parameters are precisely controlled.
Plasma Modified Chemical Vapor Deposition (PMCVD)A modification of MCVD method is a process known as PMCVD. In addition to the normal MCVD technique the radio-frequency coil around the tube generates an internal high temperature plasma.
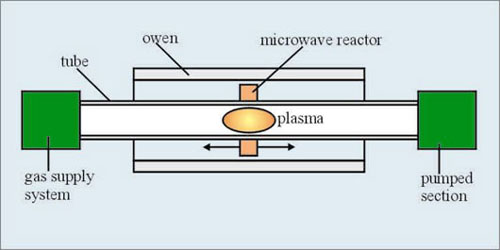
Plasma Chemical Vapor Deposition (PCVD)The PCVD method is similar to PMCVD. The radio-frequency coil is replaced by a microwave cavity resonator (Fig. 4). In this method reactions lead directly to of glass layer without forming the soot.
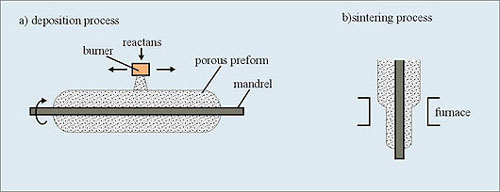
Outside Vapor Deposition (OVD)This process is also called the "soot process". It was exclusively used by Corning since the 1970s, and the patent of such a technology has expired since July 2000.
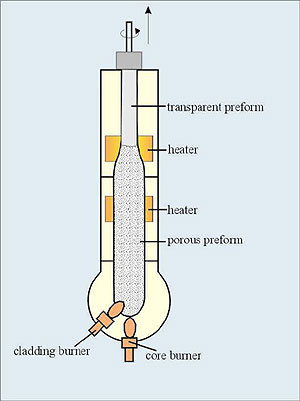
Vapor-phase Axial Deposition VADIn VAD method (in contrary to above methods) the perform can be fabricated continuously. Starting chemicals are carried from the bottom into oxygen-hydrogen burner flame to produce glass soot which is deposited on the end of a rotating silica rot. A porous preform is then grown in the axial direction. The starting rod is pulled upward and rotated in the same way as that used to grow single crystals. Finally the preform is dehydrated and vitrified in ring heaters (Fig. 6). This process is preferred for the mass production.
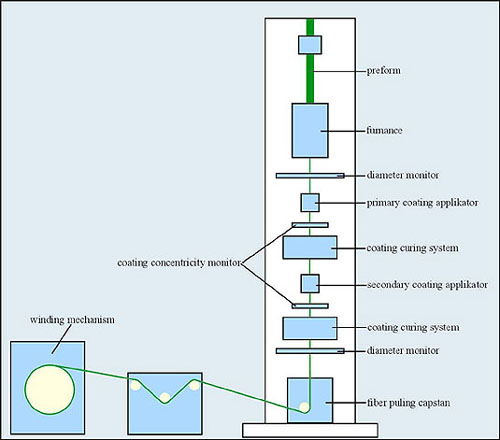
Fiber DrawingOptical fibers are obtained by drawing from the preform at high temperature. The drawing process must be integrated with the coating process to avoid contamination of fiber surface. These processes are shown schematically in Fig.7.
The tip of the perform is heated in a furnace to a molten state. Formed molten gob falls down under the force of gravity while shrinking in diameter into a proper diameter strand. It is controlled continuously during the drawing process. Diameter drift cannot exceed 0.1%. The strand is threaded through a series coating applicators immediately after drawing. Liquid prepolymer coatings are cured by thermal or ultraviolet apparatus. Dual coating, soft inner and hard outer, is needed to avoid microbending and protect against impact and crushing forces in either manufacturing process or installation. silicone coating and acrylate, Tefzel (ETFE), Teflon (PFA), nylon buffers are applied during the fiber drawing, while additional materials such as Hyrtel and PVC can be extruded after the draw process. The fiber with coatings is pulled down and wound on a winding drum. The drawing process must take place in air conditioned room, because air pollution influences fiber attenuation. References
|
|